Resources
Guides
Blog
Blog
About Us
Join Waitlist
Contact
All Blog Posts
Build a Revenue Dashboard in Notion
A basic example of an internal revenue dashboard in Notion using familiar no code tooling. This example utilizes Stripe, Whalesync, Airtable, Superchart, and Notion and includes a basic guide to get started.
June 12, 2023
How to Embed Data Visualizations into Wordpress
Embedding data visualizations within Wordpress allows businesses to display charts in customer portals, highlight data to build trust with site visitors, and improve SEO
May 9, 2023
How to Create an Analytics Dashboard in Webflow
Embedding an Analytics dashboard within Webflow allows businesses to display charts in customer portals, highlight data to build trust with site visitors, and improve SEO
May 9, 2023
Can You Export Airtable to Excel?
Can you export Airtable to excel? Short answer, yes; Long answer, not really. Here you'll find a description of the basic funcationality.
April 18, 2023
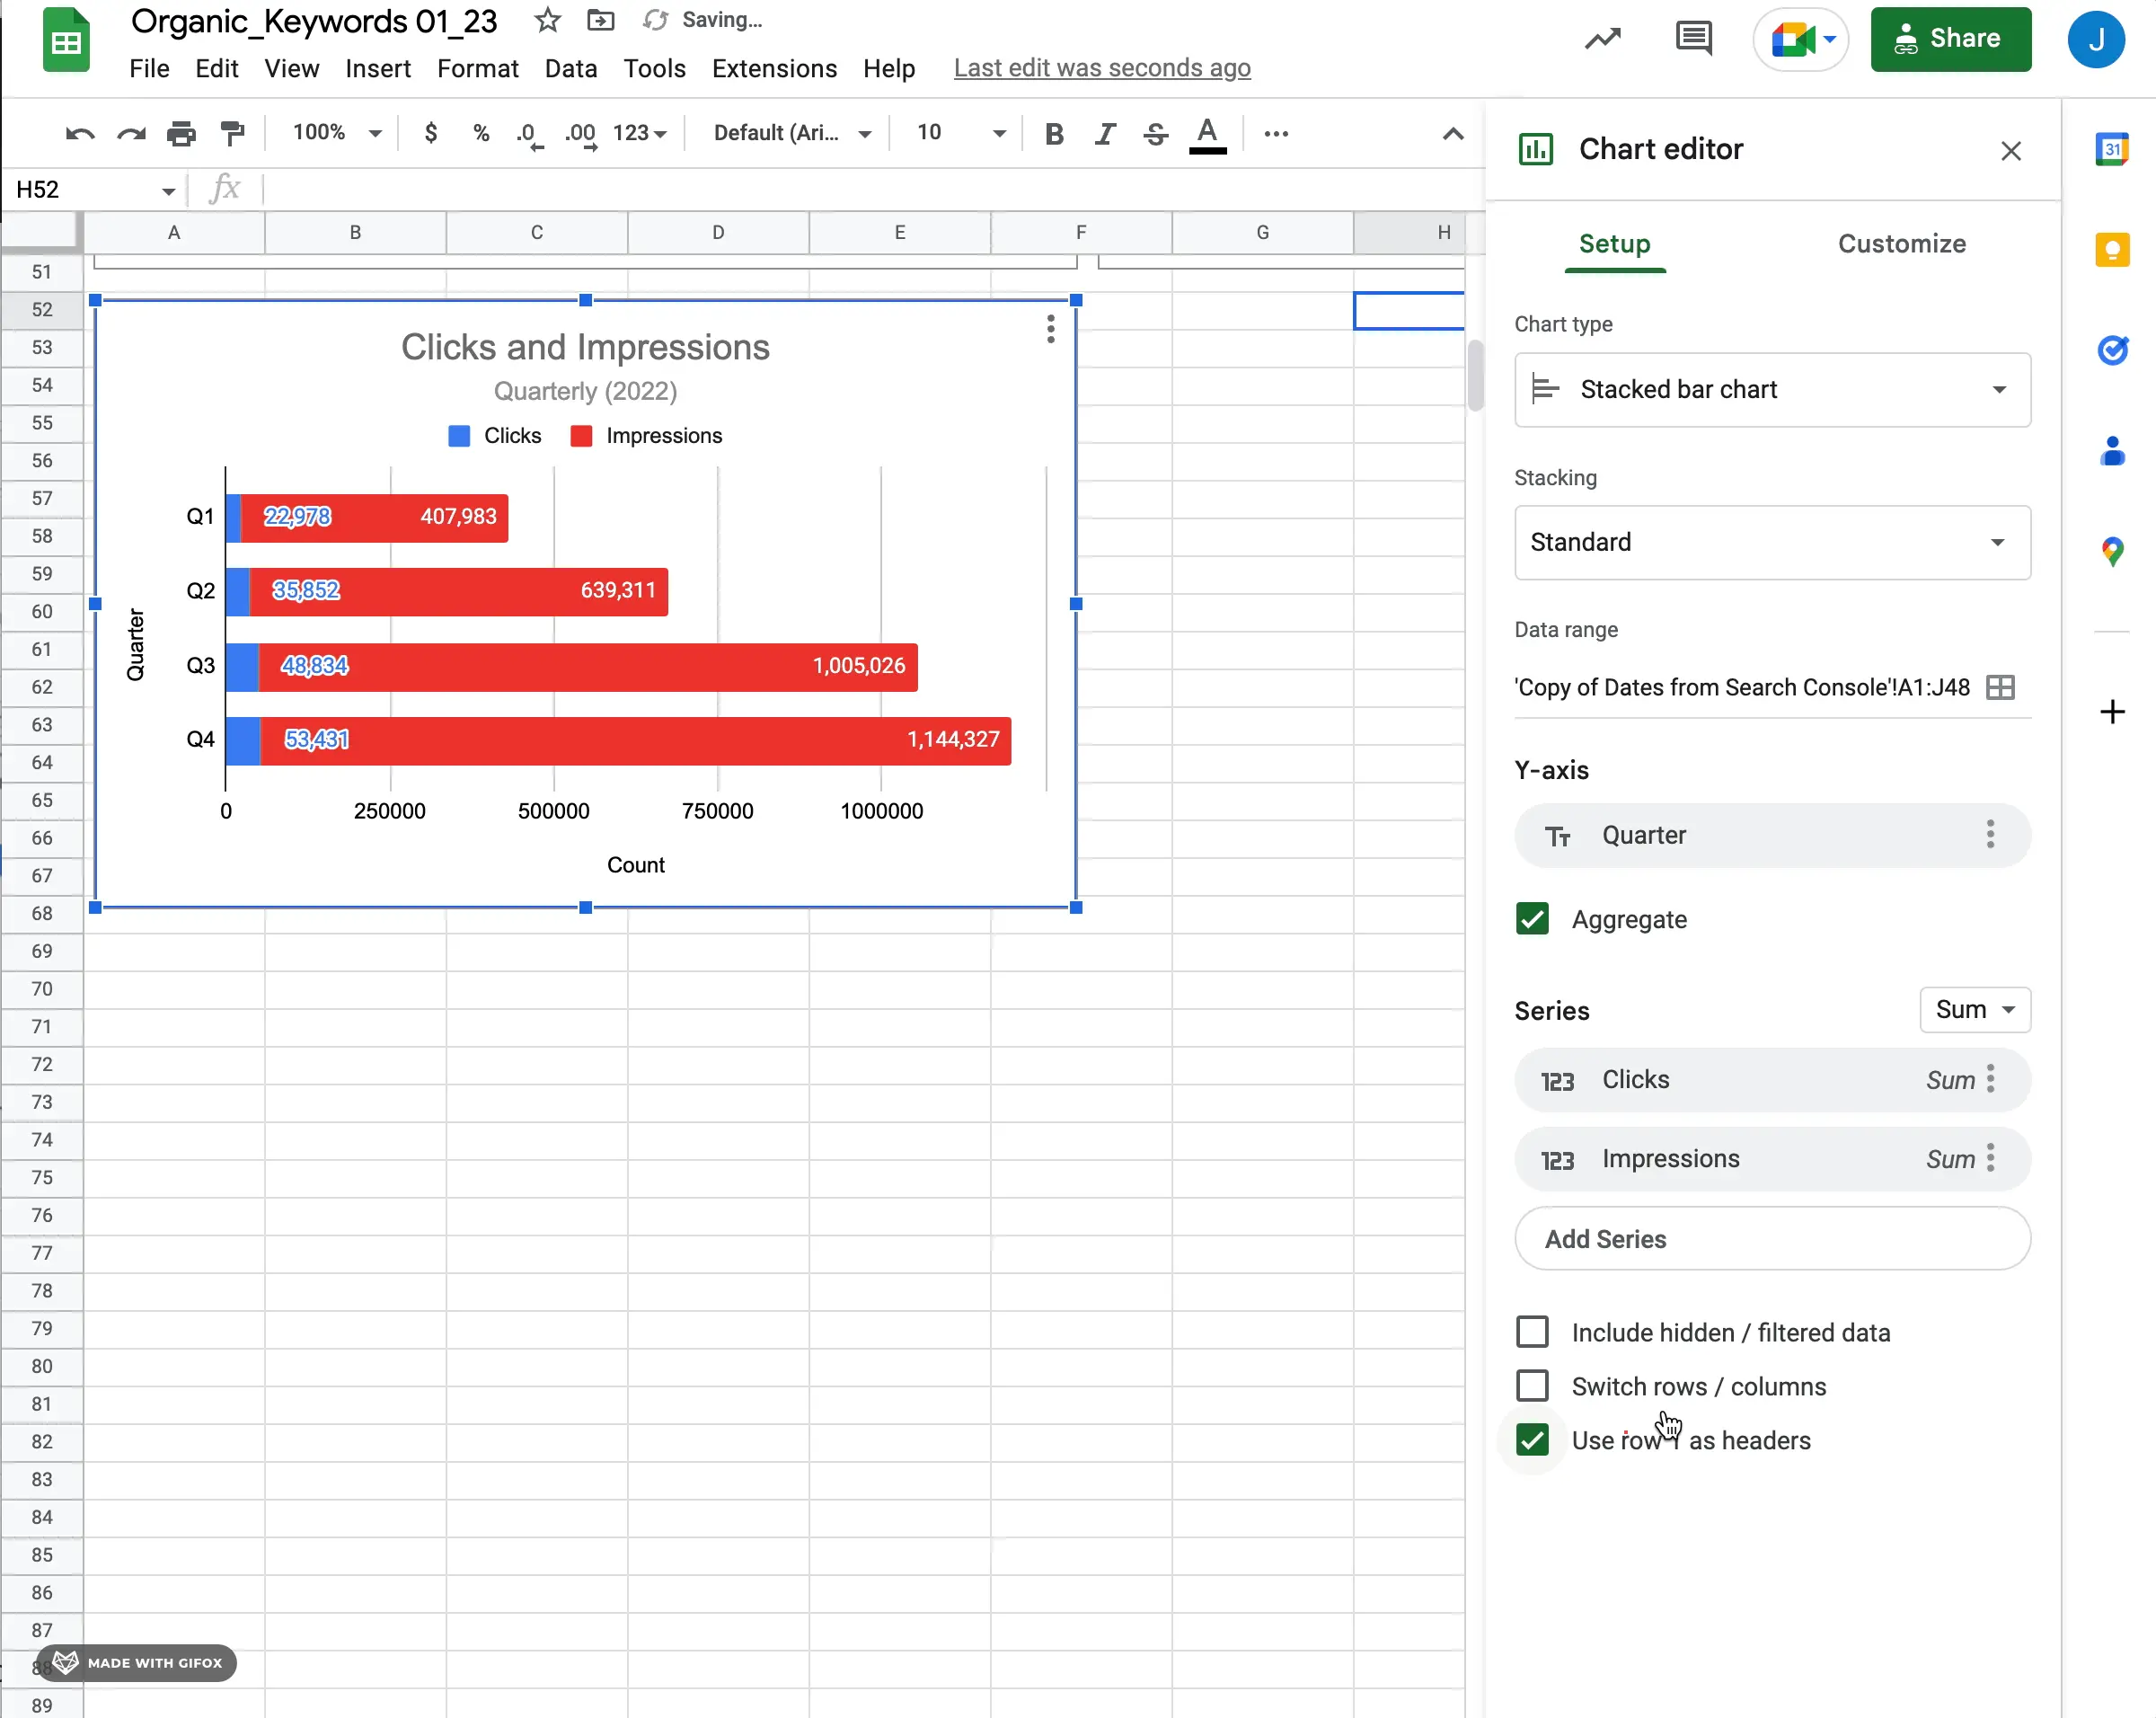
How To Create a Bar Chart in Google Sheets
How to create a bar chart in google sheets, along with some of the most important considerations for configuration.
April 12, 2023
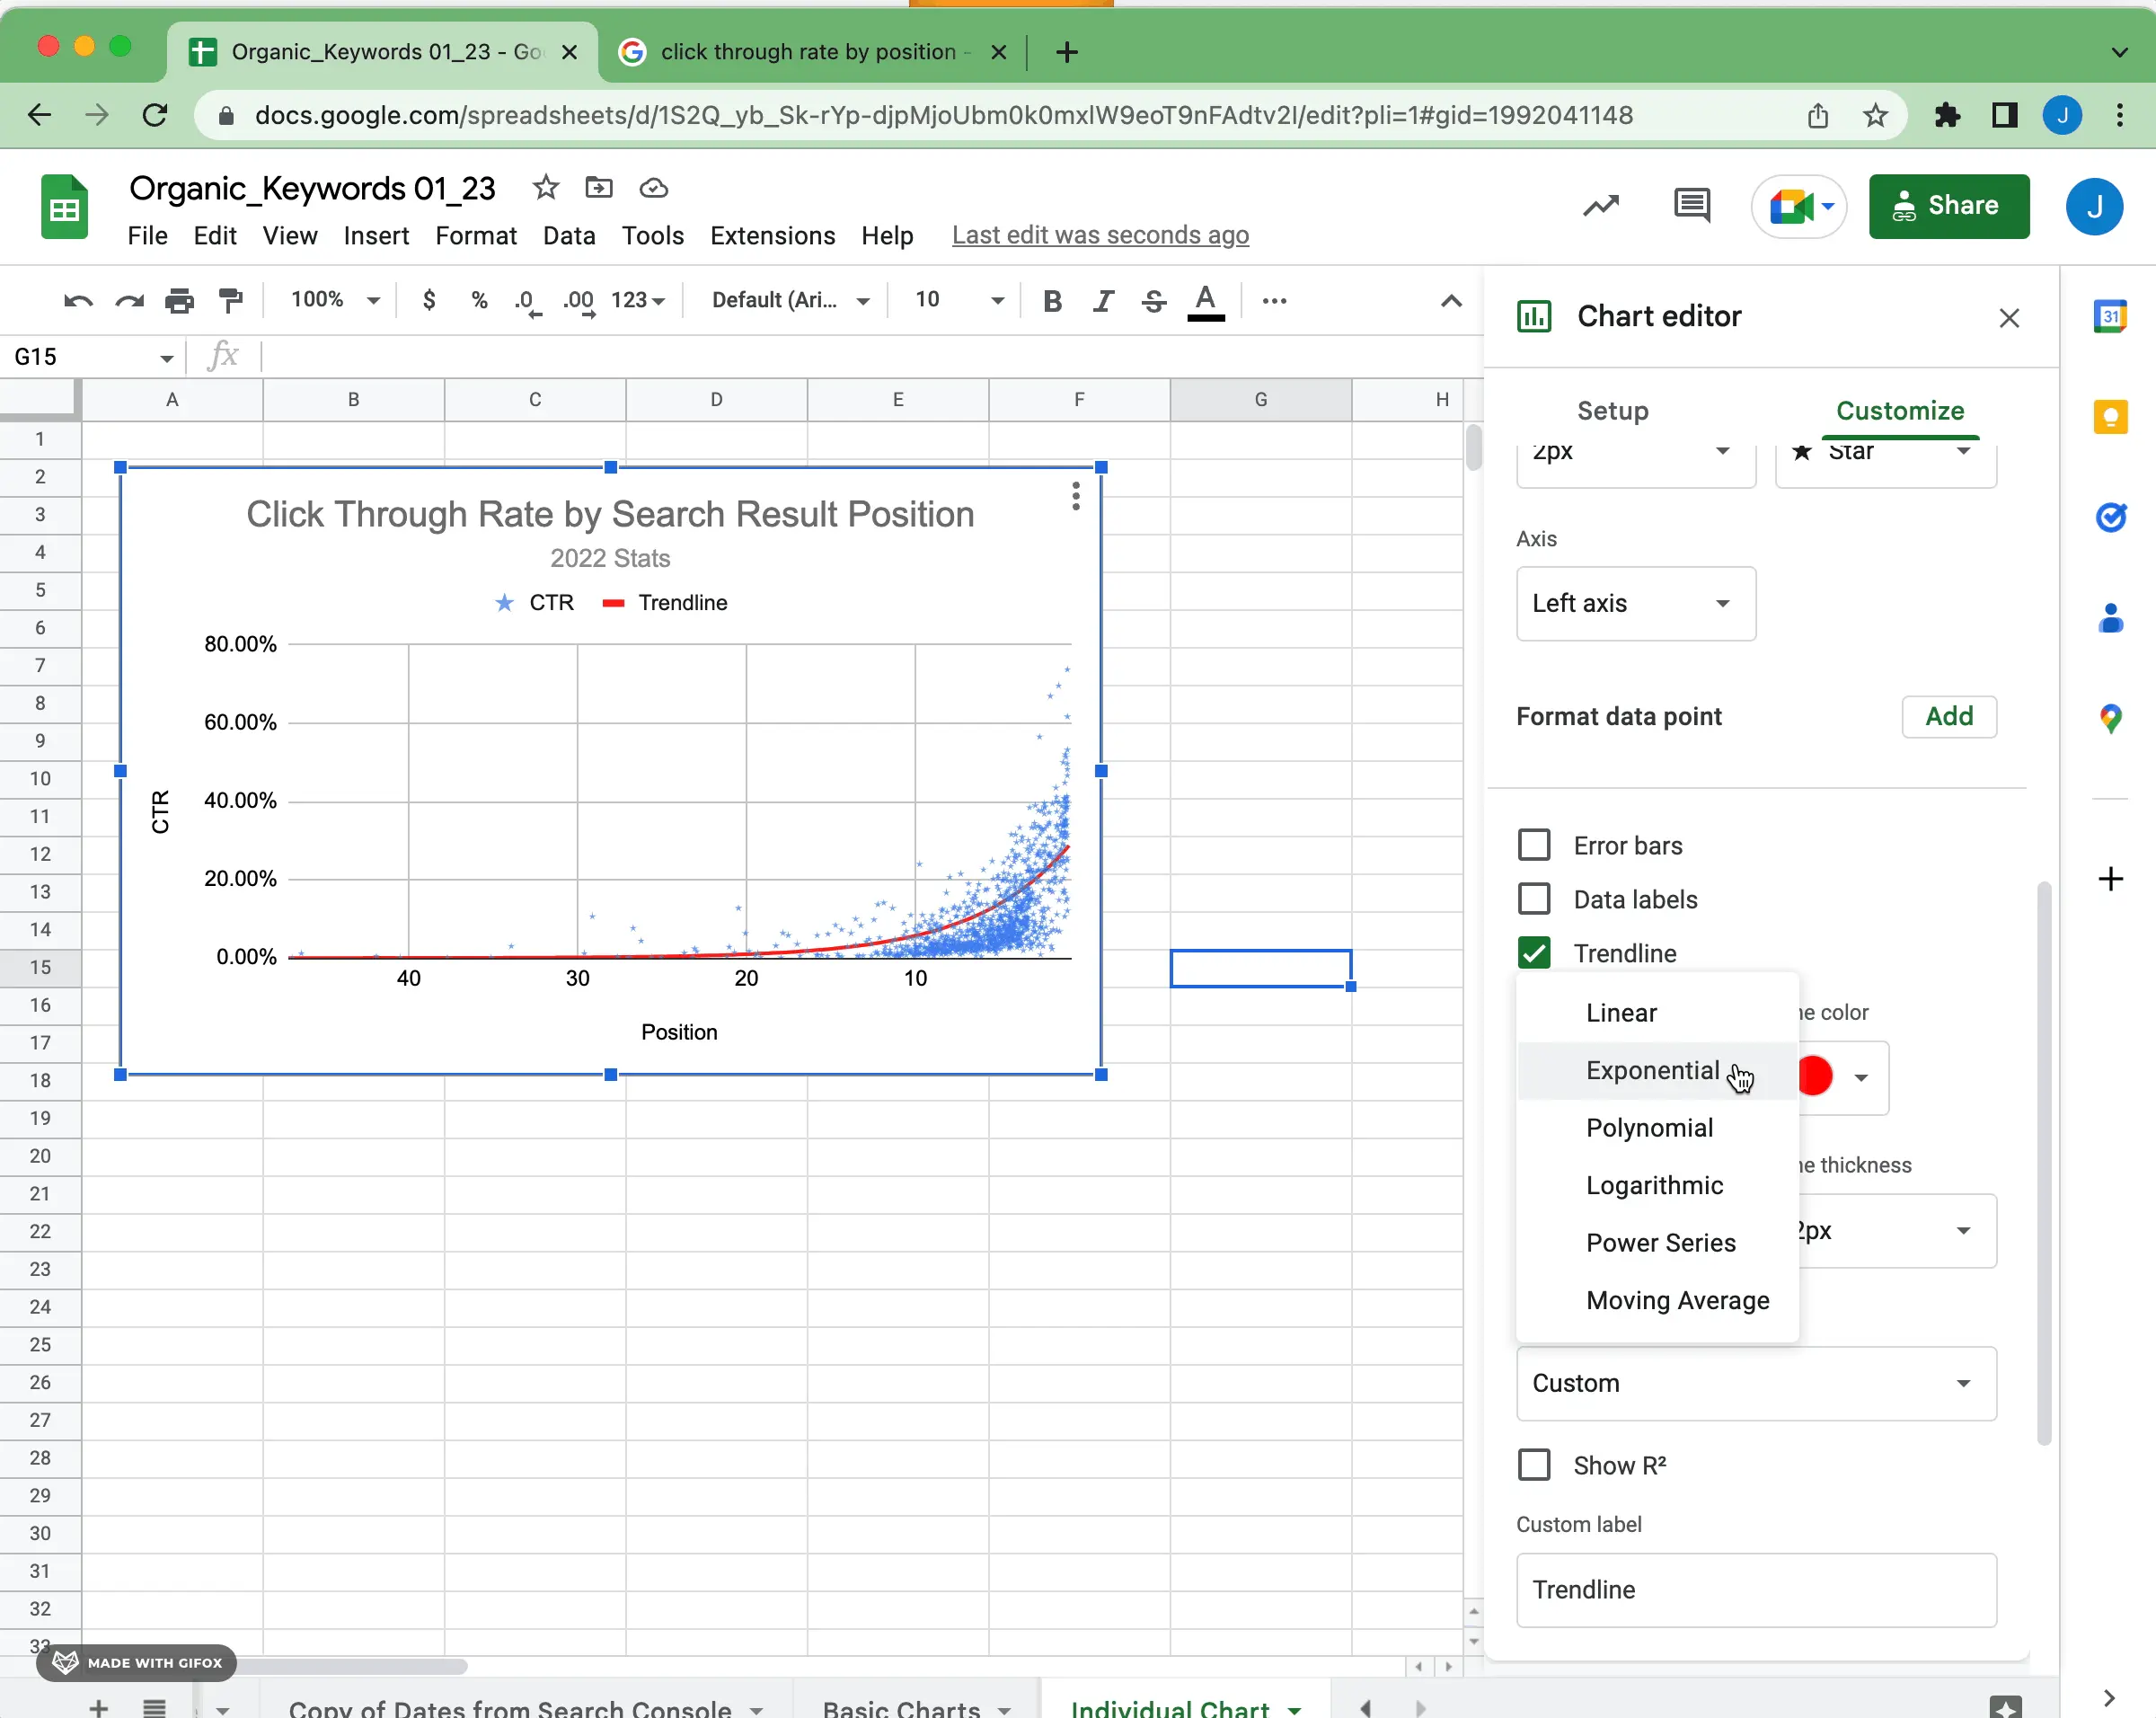
How To Create a Scatter Plot Using Google Sheets
How to make a scatter plot in Google Sheets and some examples of the most important configuration to consider.
April 11, 2023
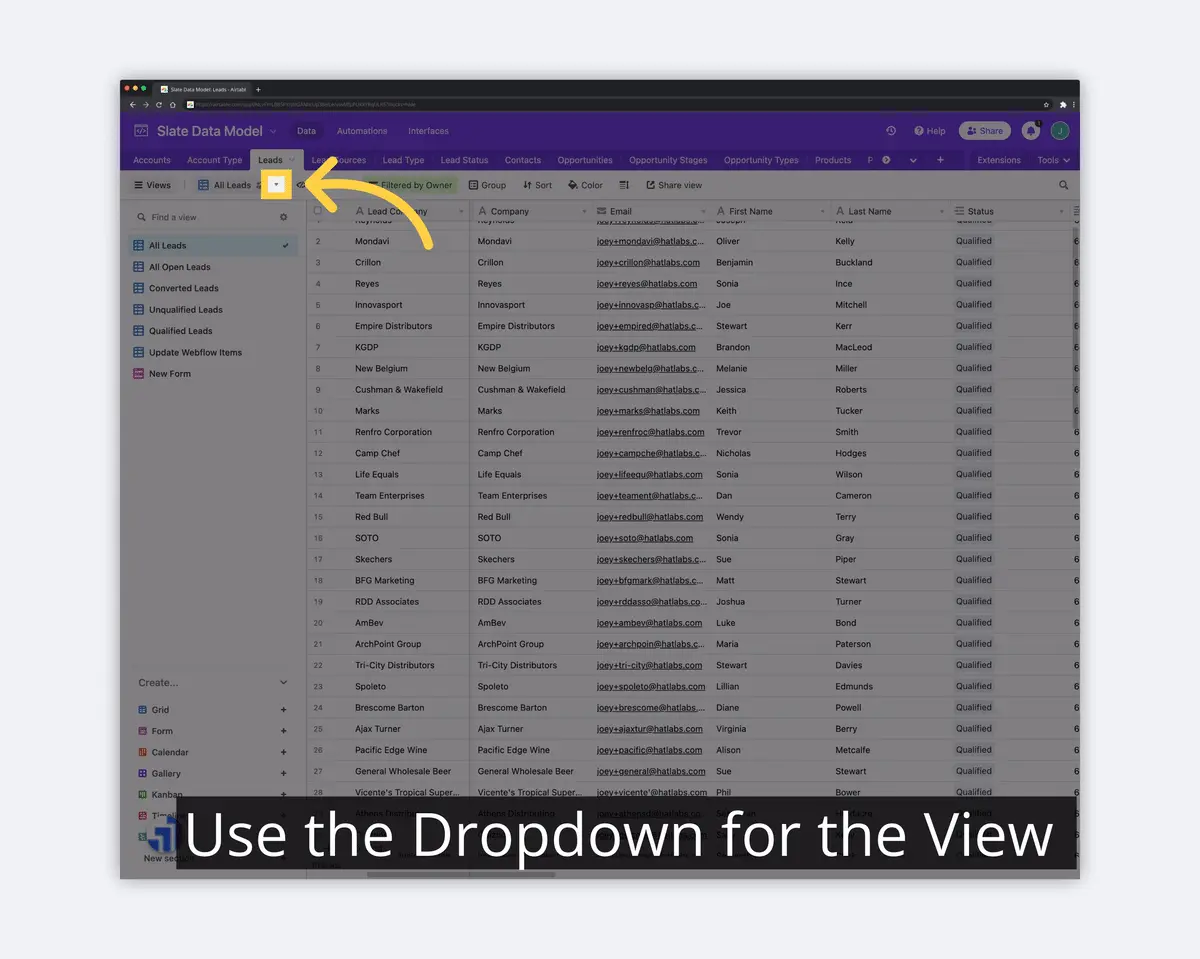
What is Airtable Used For
What is Airtable used for? Why is it popular? What are some good examples for using Airtable? This and more.
April 7, 2023
Daily Treasury Par Yield Curve Rates
The US Department of the Treasury publishes data on the par yield curve and we've visualized it here to breakdown and explain an inverted yield curve.
March 24, 2023
Airtable Basics
In this post, we'll cover basic objects in Airtable that will get you off the ground. A good place to start if you're just getting familiar with Airtable.
April 13, 2023
Why Airtable?
What is Airtable used for and why use Airtable? There are a few key reasons for Airtable's blowout success.
April 7, 2023
Next